
LinkUp Forecasting Net Gain of 175,000 Jobs in January
Total U.S. job openings sourced from company websites around the world rose 3% while new openings jumped 30%

With the clock ticking as we race to get our NFP forecast posted before the end of the day, we’ll refrain for the time being on any commentary around the job market, the economy, the Fed, and the broader backdrop of what’s been going on in the U.S. for the past few weeks and jump straight to the data and our forecast (not much news on that last one anyway).
One thing we will note, however, is that while we’ll still report our monthly data here as we always have - using our job openings data sourced directly every day from corporate and employer websites around the world for each calendar month, we have changed the time series of the data we use in our NFP forecast model such that it coincides with the survey week that the BLS uses for its jobs report. The time series we’re now using just for the forecast, the last chart in this post, includes data from the 20th of the prior month to the 19th of the current month.
Looking at the complete calendar month of January, LinkUp job openings in the U.S. rose 3%, while new jobs skyrocketed 30% and removed jobs jumped 19%.

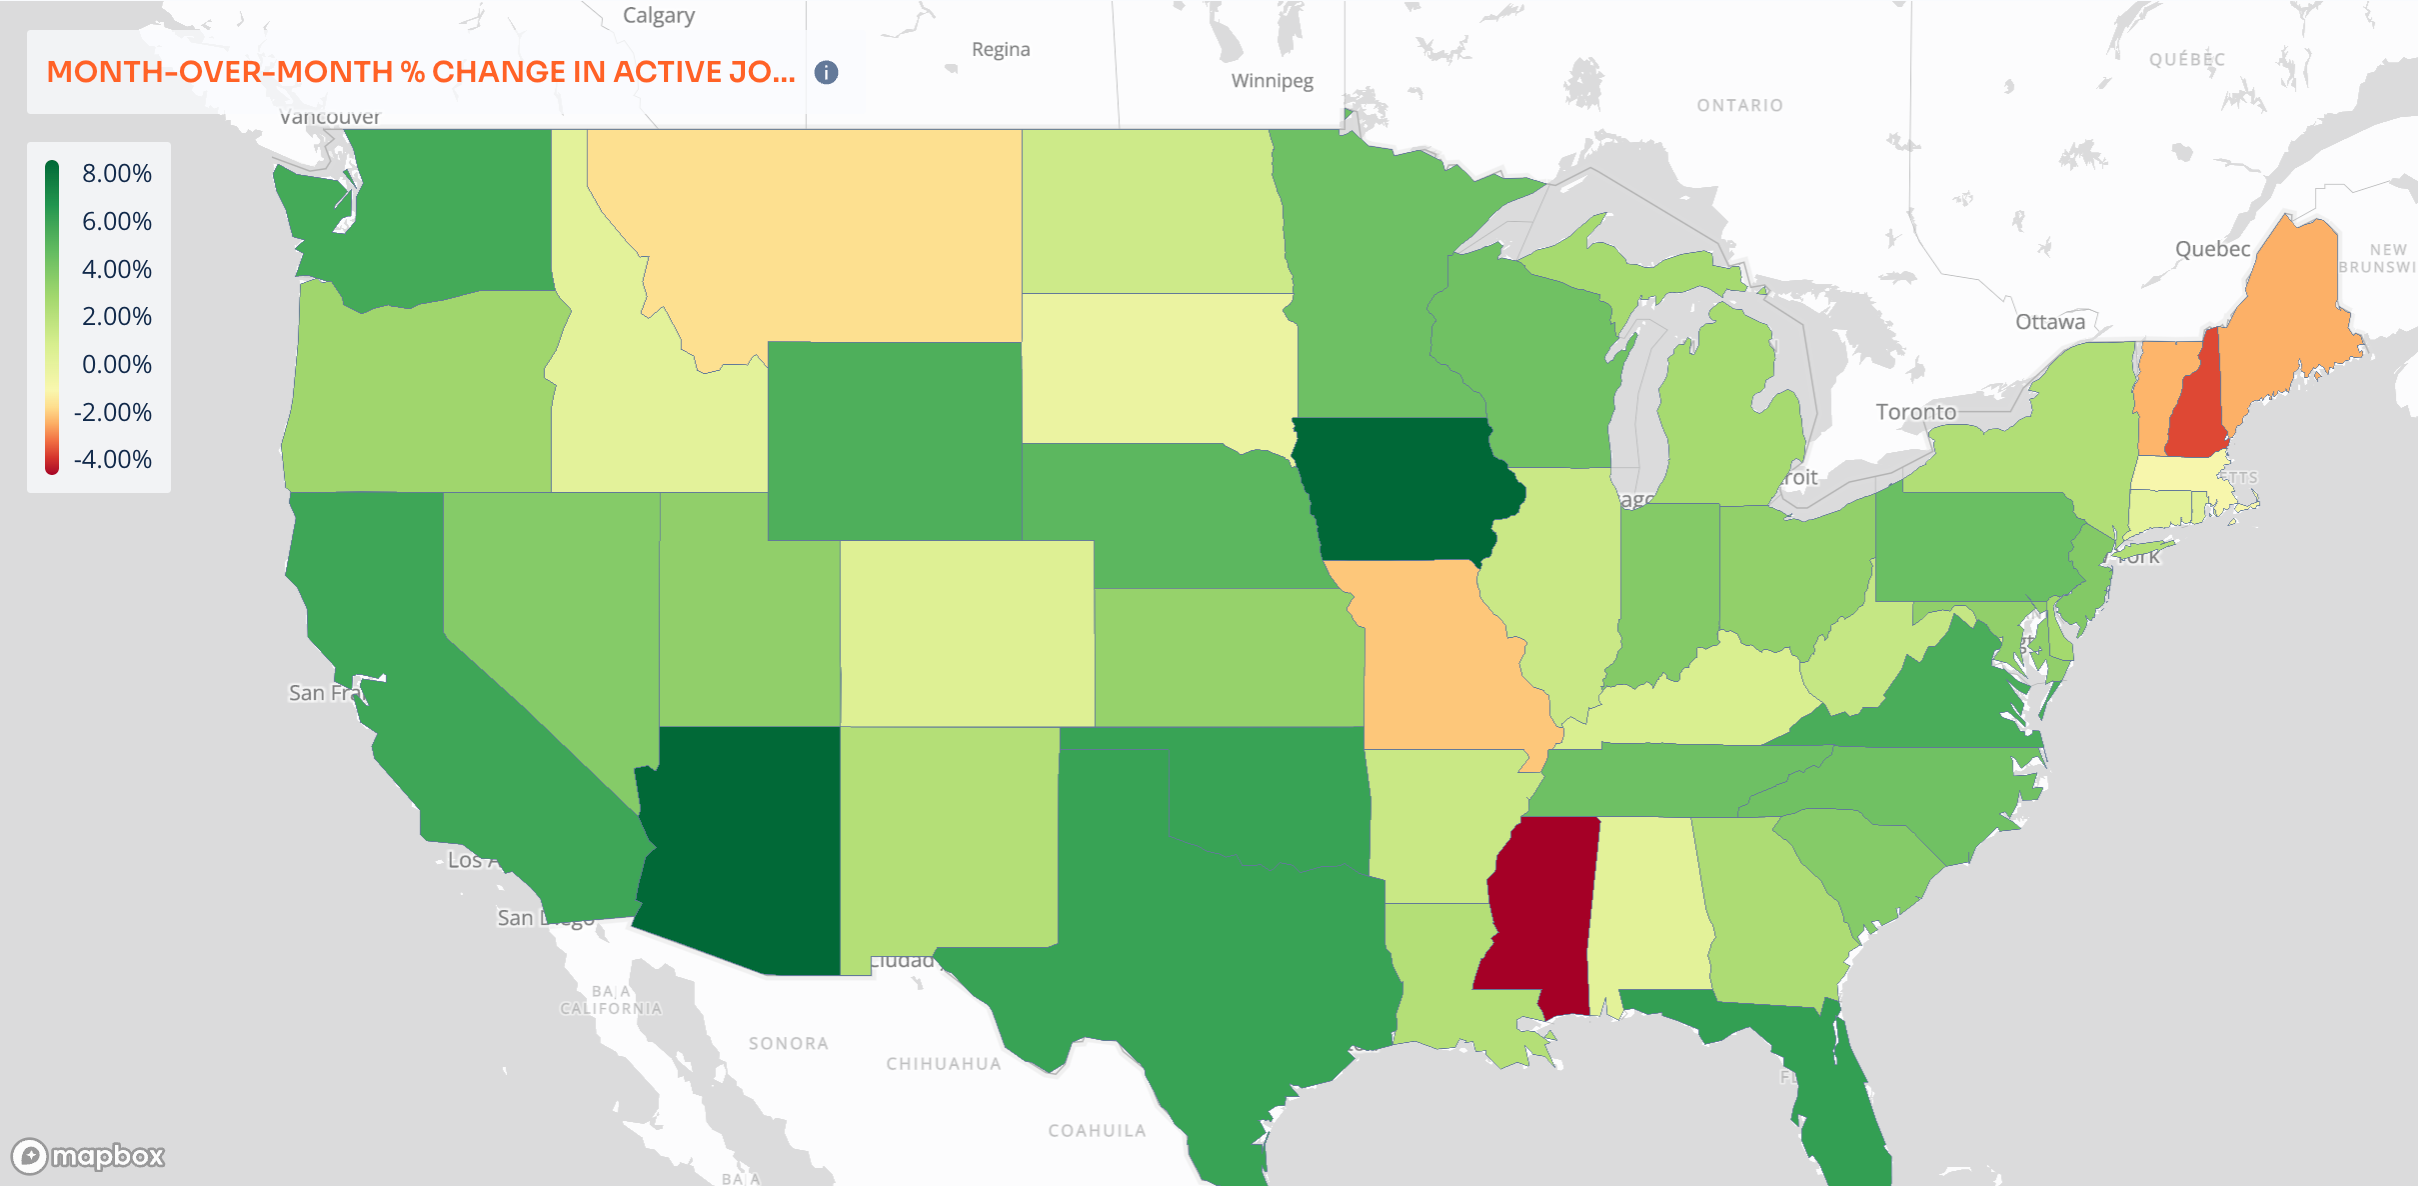
Job openings rose in 44 states including Hawaii and Alaska.
For the month, labor demand rose in both manufacturing and services.

Openings rose in all but 6 industries…

…with the largest gains in Management of Companies, Mining, and Finance.

Labor demand rose for both white and blue collar jobs...

…with gains in all but 3 occupations….
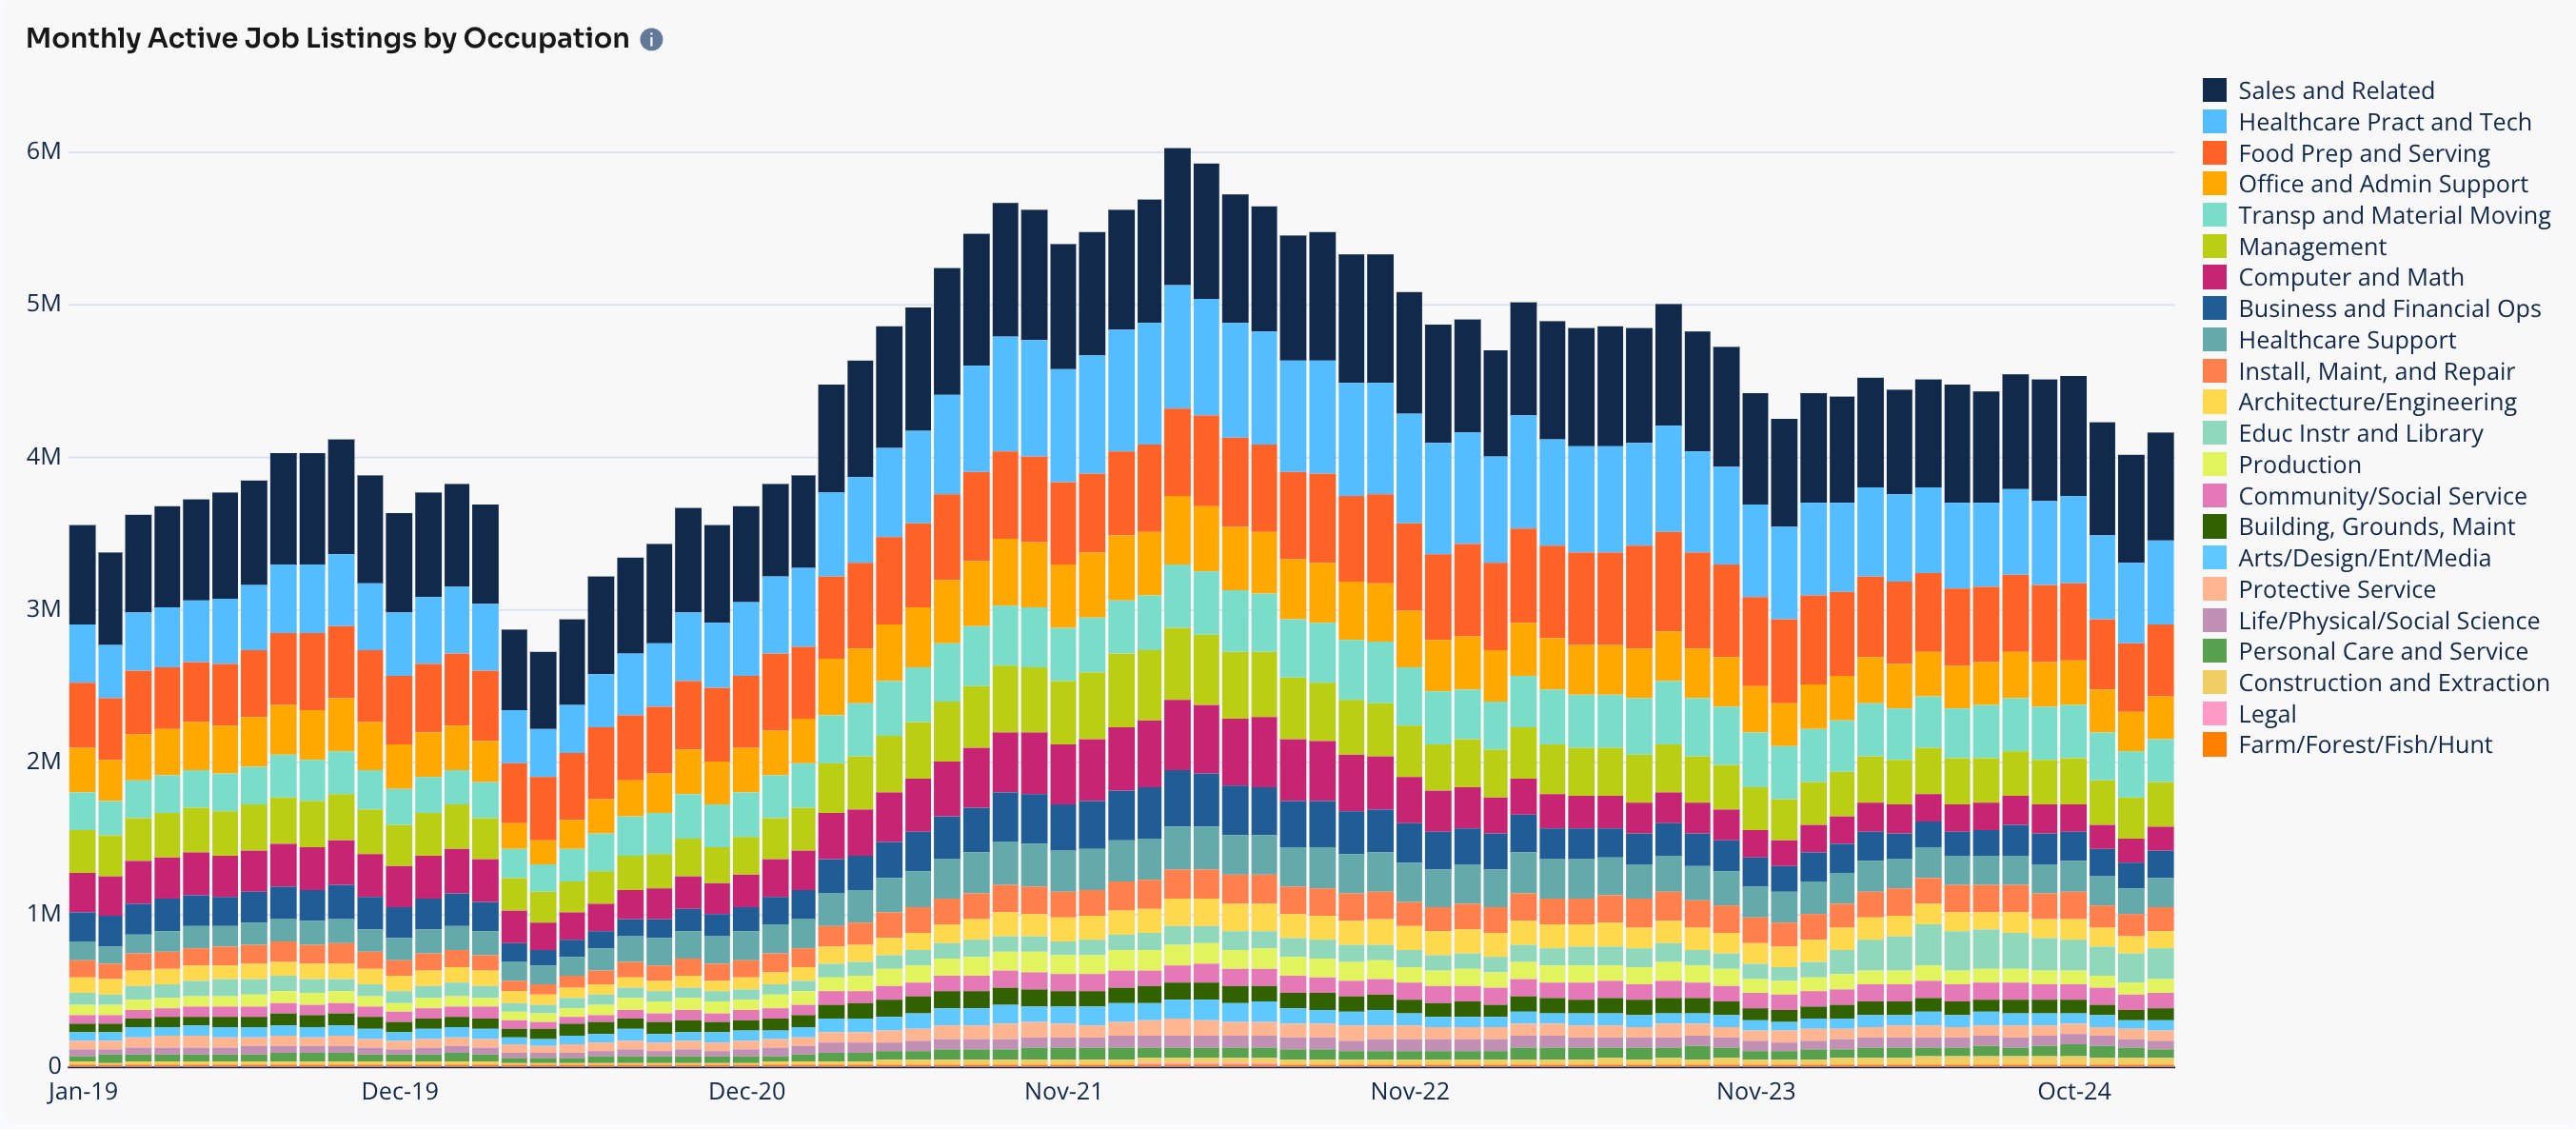
…and the largest gains in Farm/Forest, Production, and Arts/Design/Entertainment/Media.

In January, Closed Duration, which essentially measures Time-to-Fill or Hiring Velocity across the entire economy, rose to 50 days.
Closed Duration is a highly useful metric that measures Time-to-Fill based on the number of days an opening, on average, is open on a company’s corporate career portal before it is closed and removed.

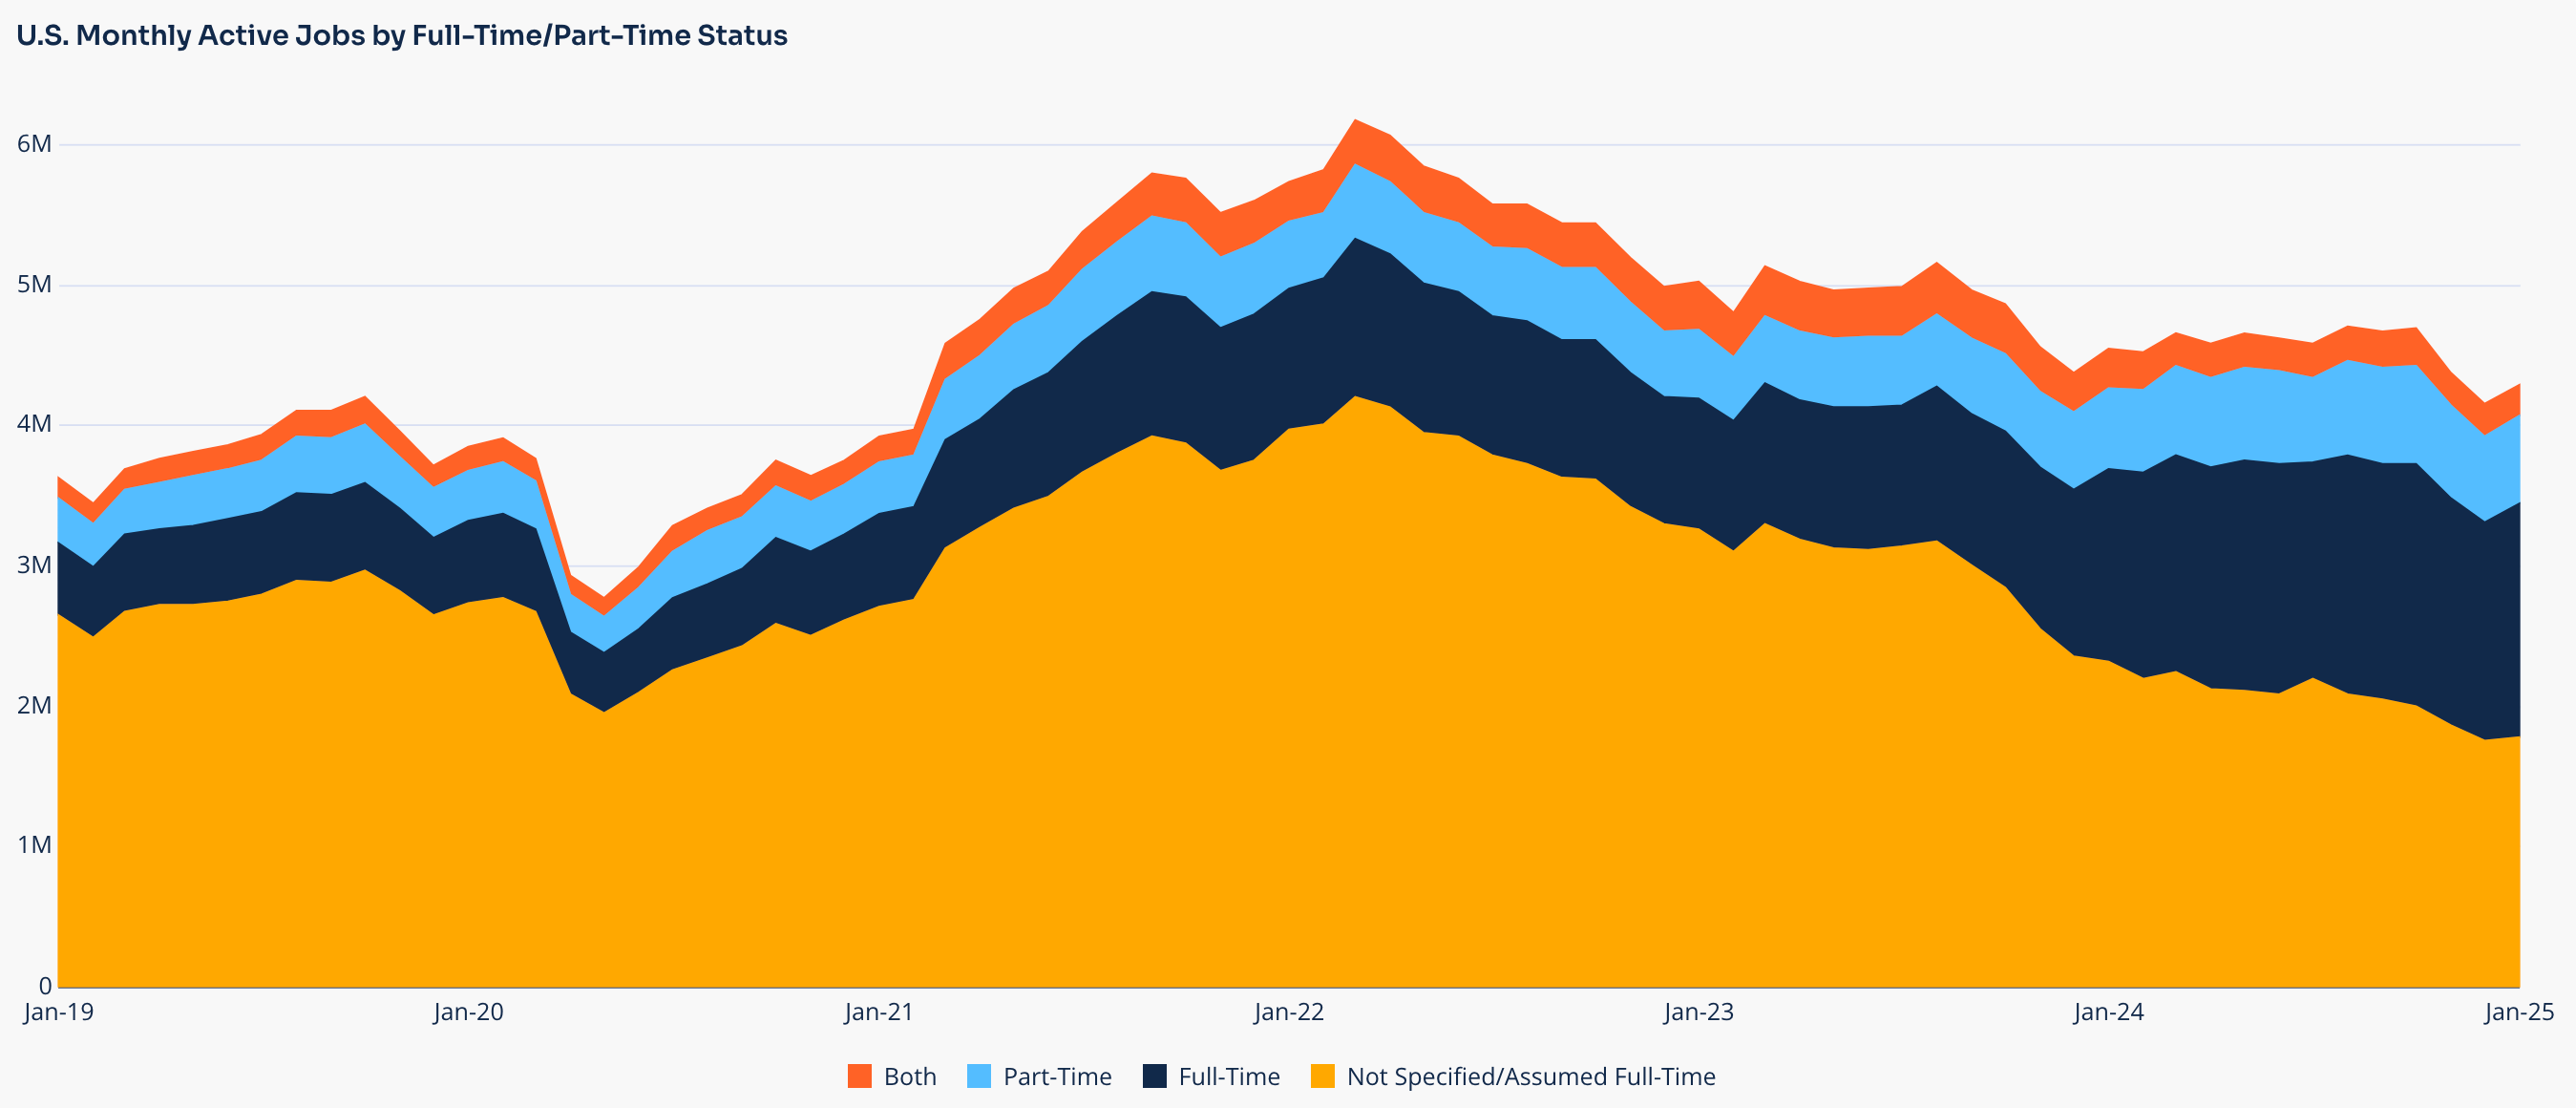
Part-time jobs stayed relatively flat at roughly 15% of all job openings, as did jobs that were classified as either part-time or full-time (5%).
As note above, we’ve made a slight tweak to our NFP model by using a time series that runs from the 20th of the prior month to the 15th of the month being reported so that the time series coincides more directly with the BLS survey week which is always the week that includes the 12th of every month. So for January’s data for our model, the data we used includes new, removed, and total unique U.S. job openings in our data from the 20th of December through January 19th.
Using that same methodology (what we’re calling ‘Mid-Month’ data), we’ve mapped that data for the months since January 2019 relative to our normal calendar-month data in the chart below. The two times series are quite similar, but there are occasionally some timing variations, one of them being January 2025 when the calendar data shows an increase and the mid-month data showing a decline.
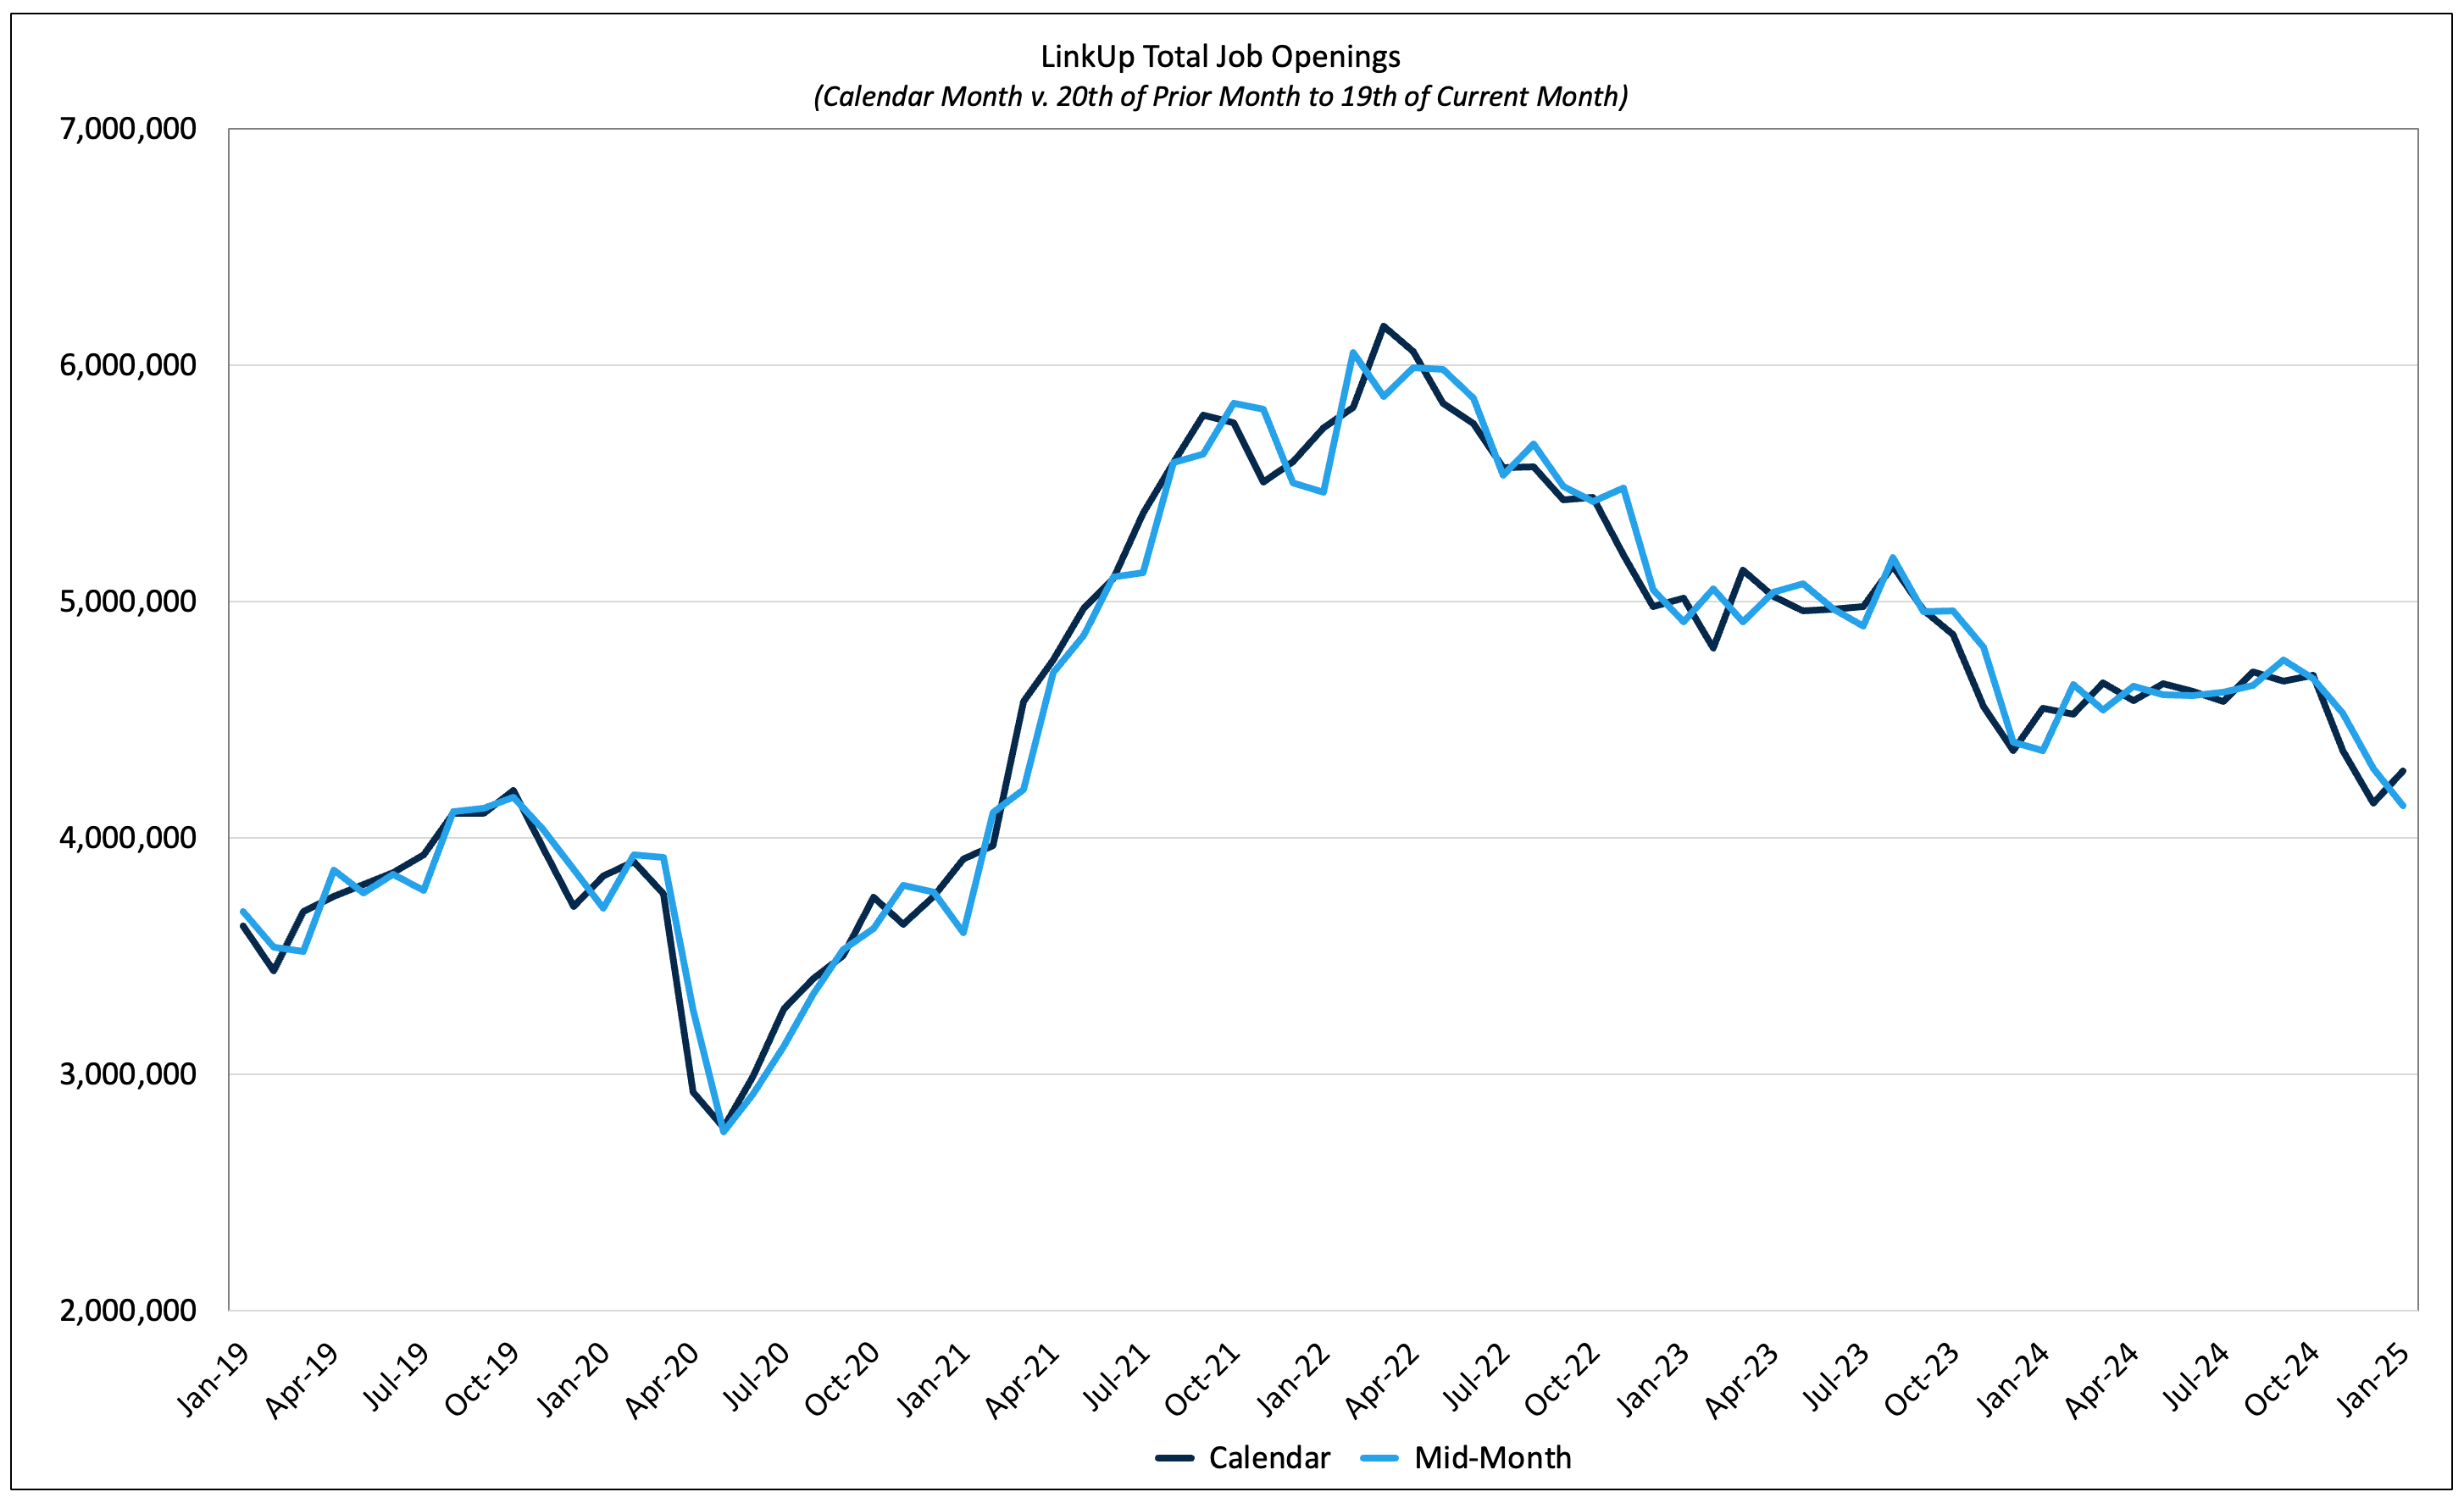
So based on our Mid-Month data and the 9% drop we saw in December, we are forecasting a net gain of 175,000 jobs in January, slightly above consensus estimates but a drop from December’s gain of 256,000 jobs.

Look for our 2025 predictions in the next week or so along with some commentary about our 2024 predictions and what’s been a whirlwind start to 2025.